
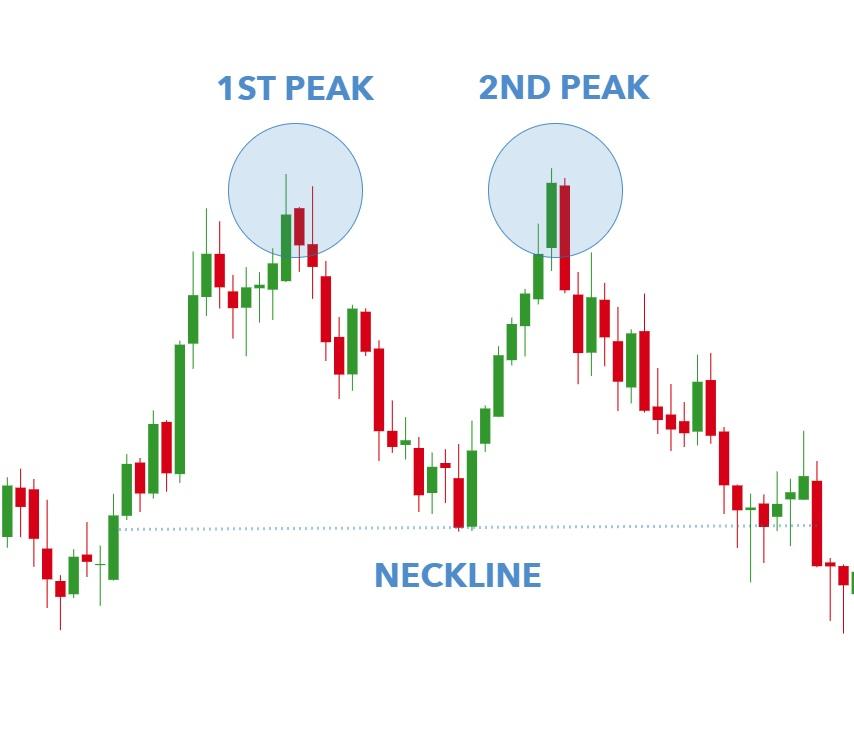
Identification: A double top pattern is a classic technical analysis chart formation representing a major change in trend and a momentum reversal from a prior up move in market trading. The double top looks like the letter inverted “W.” The twice-touched high is now considered a significant resistance level. While the trend line along the lows is known as neckline, the downside has new potential for a further downfall.
Occurrence: It describes the increase of a security or index, a drop, another rebound to the same or similar level as the original, and finally another drop (that may become a new downfall).
Study: In terms of analysis, a conservative reading of the pattern suggests the minimum-move price target is equal to the distance of the two highs and the intermediate low.