
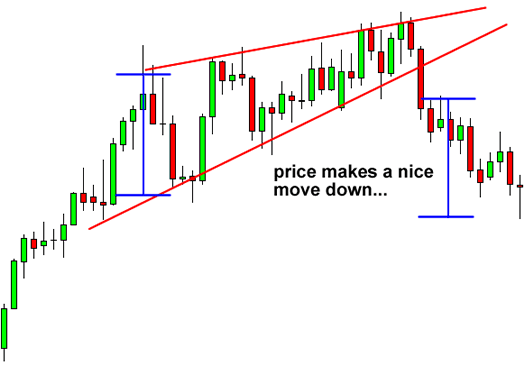
Identification: A wedge is a price pattern formed by two converging trend lines on a price chart. The two trend lines are drawn to connect the respective highs and lows of a price series during the course of 10 to 50 periods.
Occurrence: The lines show that the highs and the lows are either rising or falling at differing rates, giving the appearance of a wedge as the lines approach a convergence.
Study: Wedge shaped trend lines are considered useful indicators of a potential reversal in price action. These patterns have a good track record for predicting price reversals.